We have a commitment to deliver products that maintain a safe and secure food supply and to do so in a way that protects the environment for future generations. To reflect this commitment, in 2019 we reset our sustainability goals to challenge ourselves to further reduce our environmental impact.
Our environmental goals are reported on an intensity basis i.e., energy (in gigajoule), GHG emissions (tonne CO2 equivalent), waste disposed (tonne), and water use at high-risk locations (cubic meter) per tonne of product. In addition to these metrics, FMC also reports a number of other related metrics in line with GRI, SASB and TCFD framework requirements.
Detailed information on our environmental goals, progress, and additional metrics are available in our annual sustainability report and within our ESG data download.
Environmental Goals
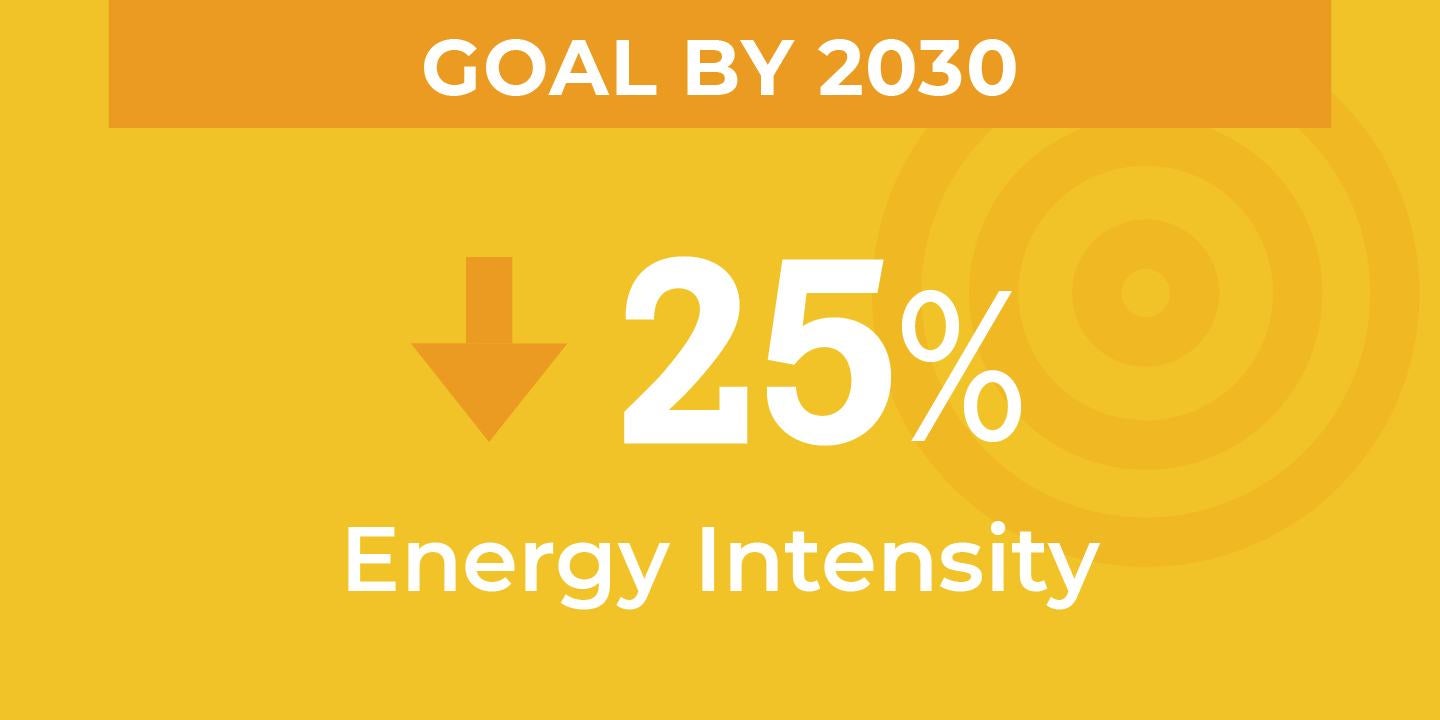
Energy Goal
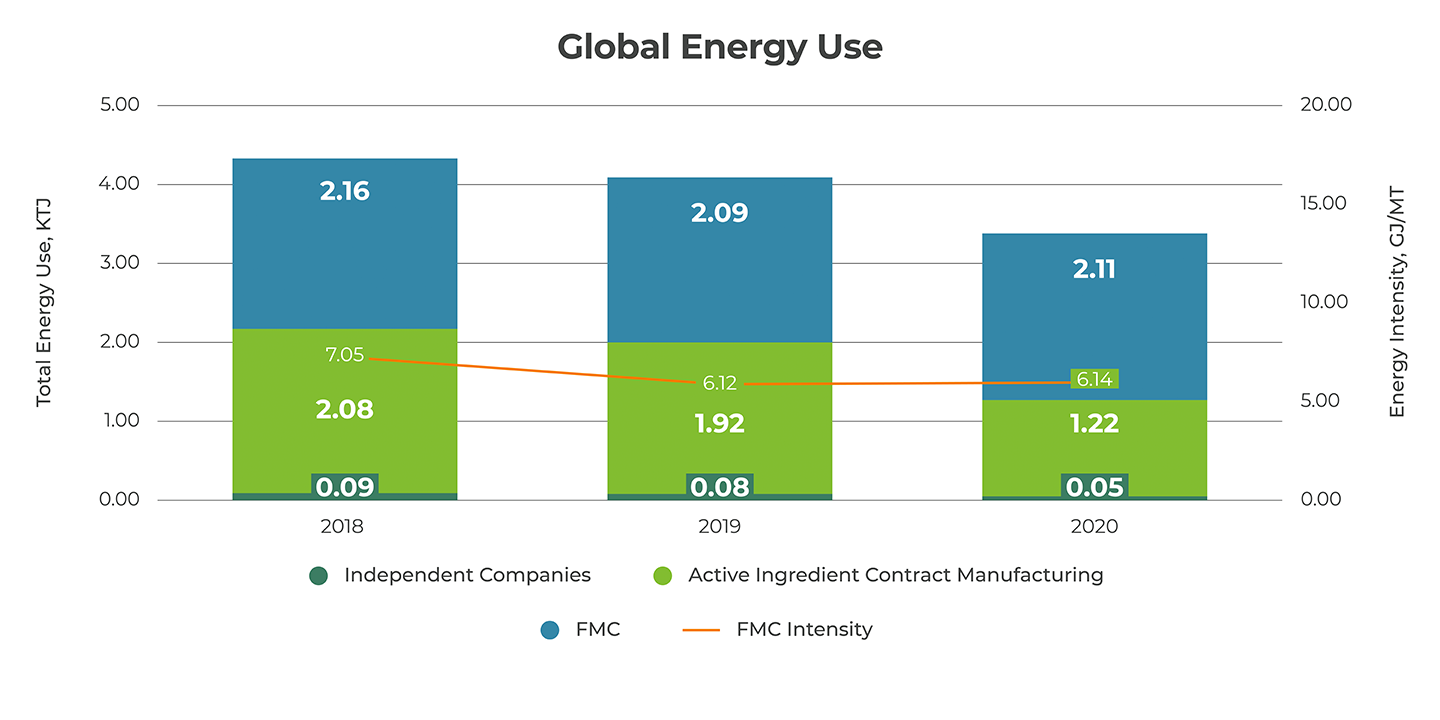
Energy intensity is calculated as the total amount of energy utilized (gigajoule) per metric tonne of product. This goal is compared to 2018 baseline.
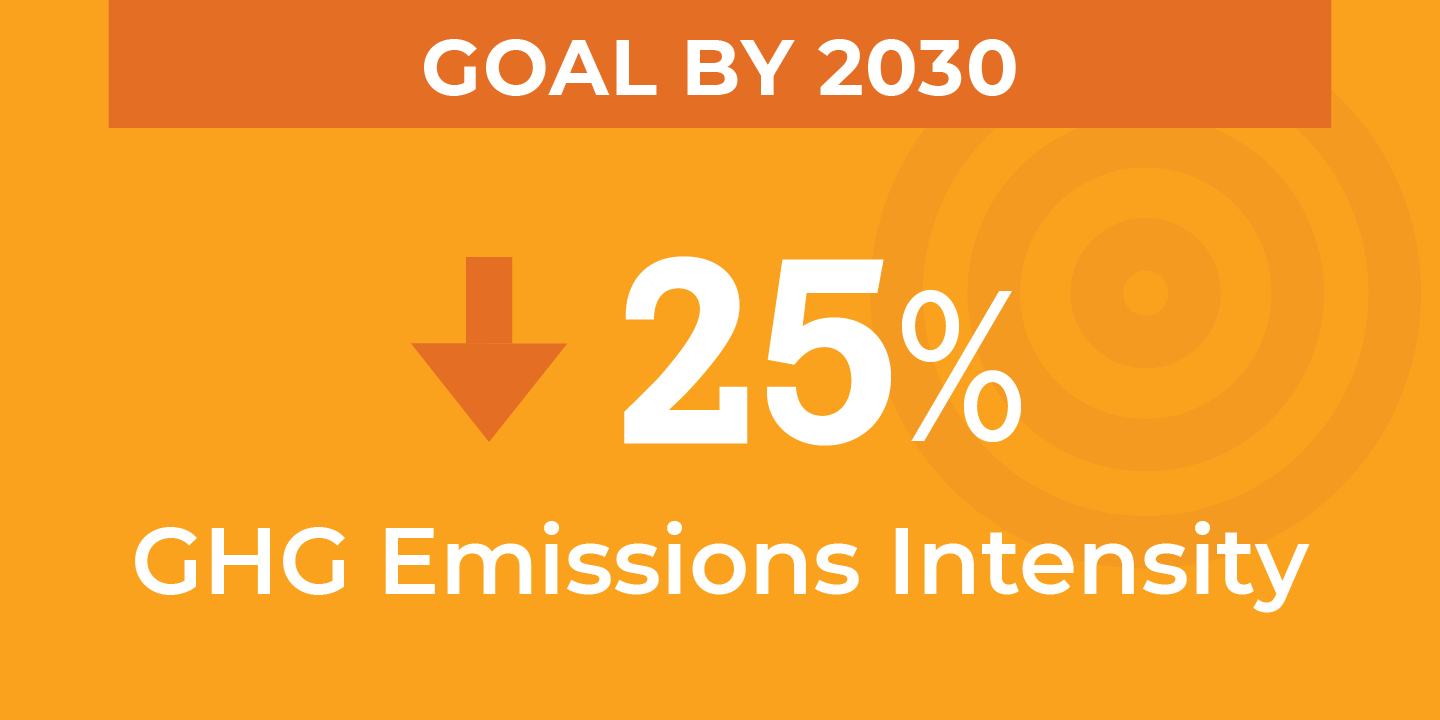
GHG Emissions Goal
GHG intensity is calculated as the total amount of GHGs (tonnes CO2 equivalent) per metric tonne of product. This goal is compared to 2018 baseline.
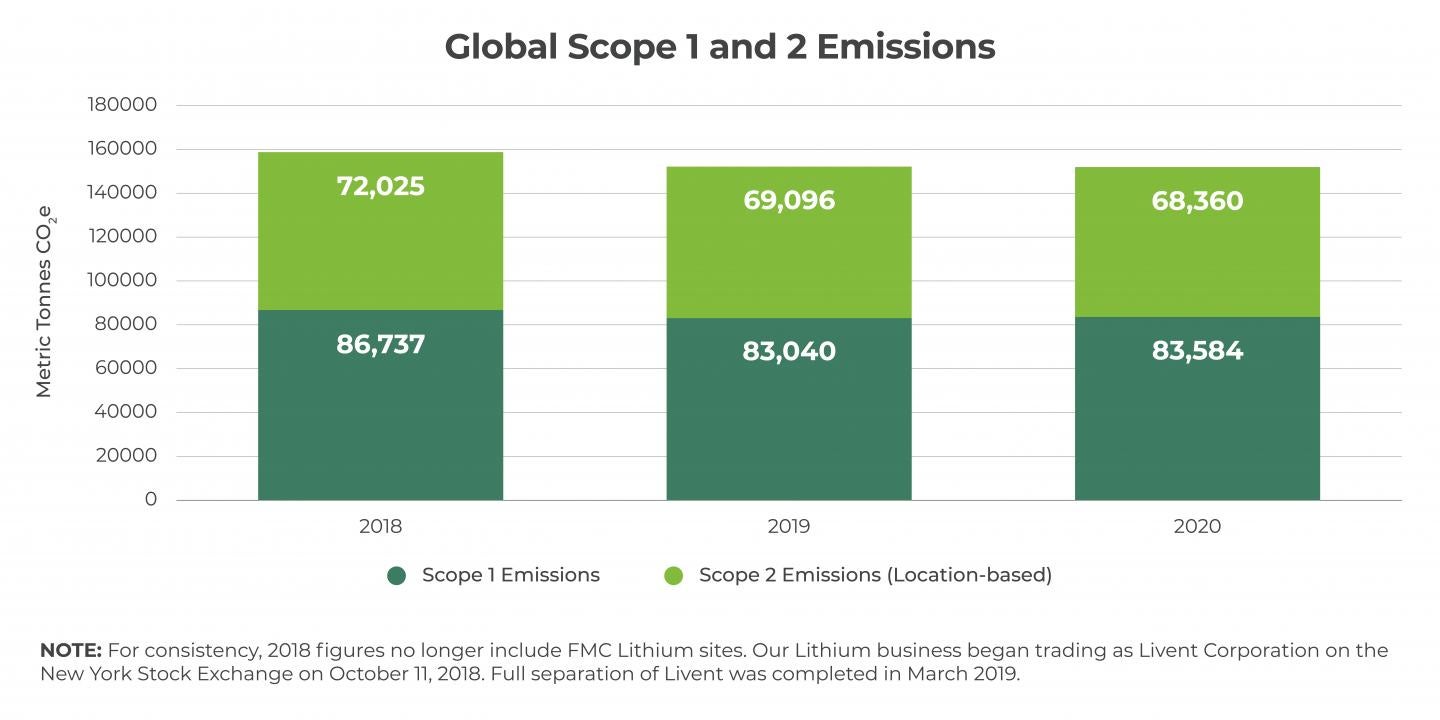
GHG Emissions Performance
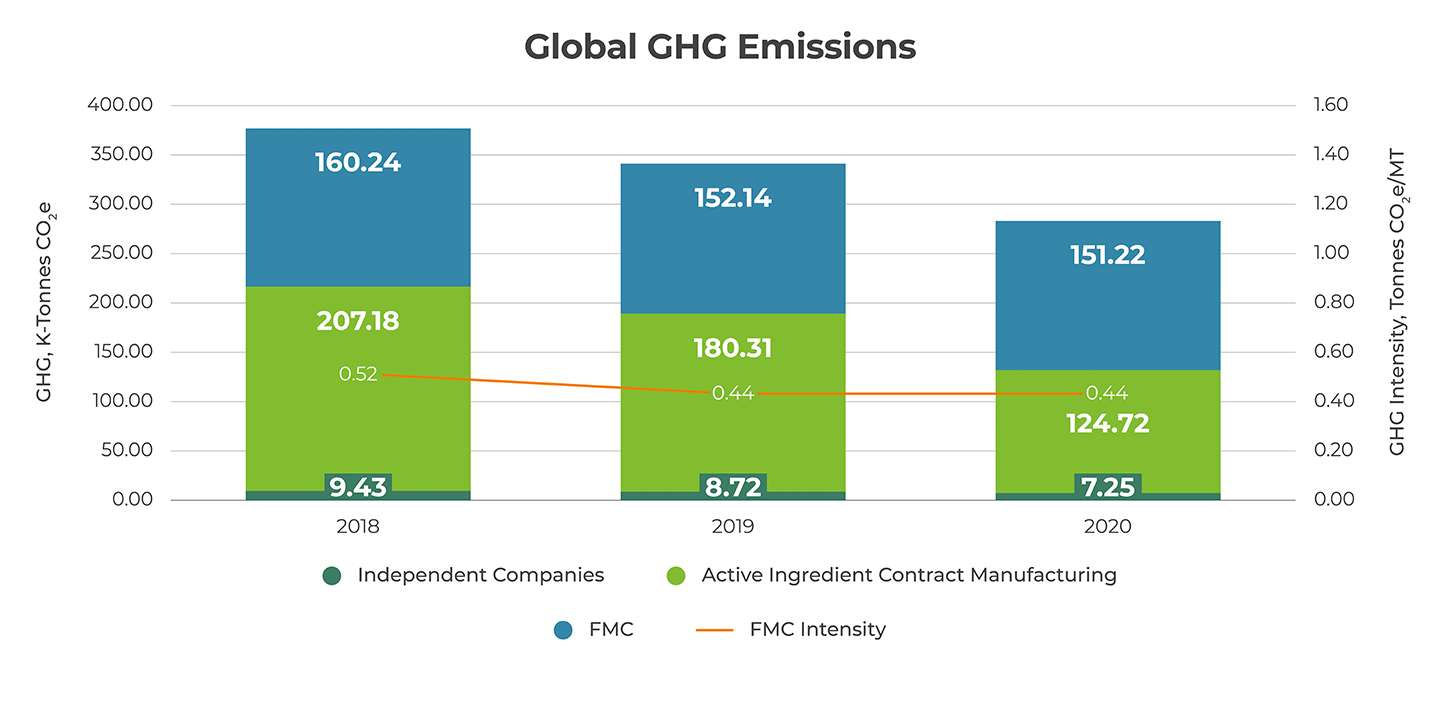
GHG Emissions Performance
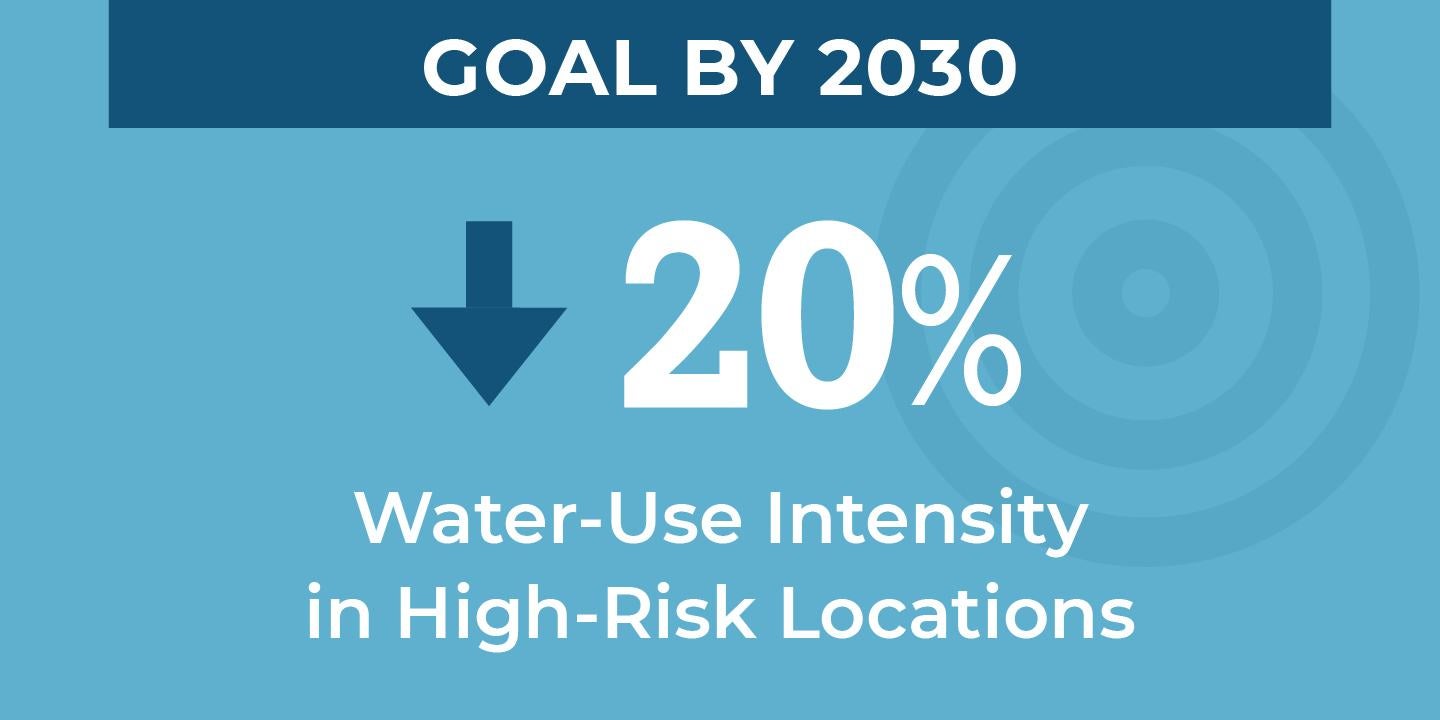
Water Goal
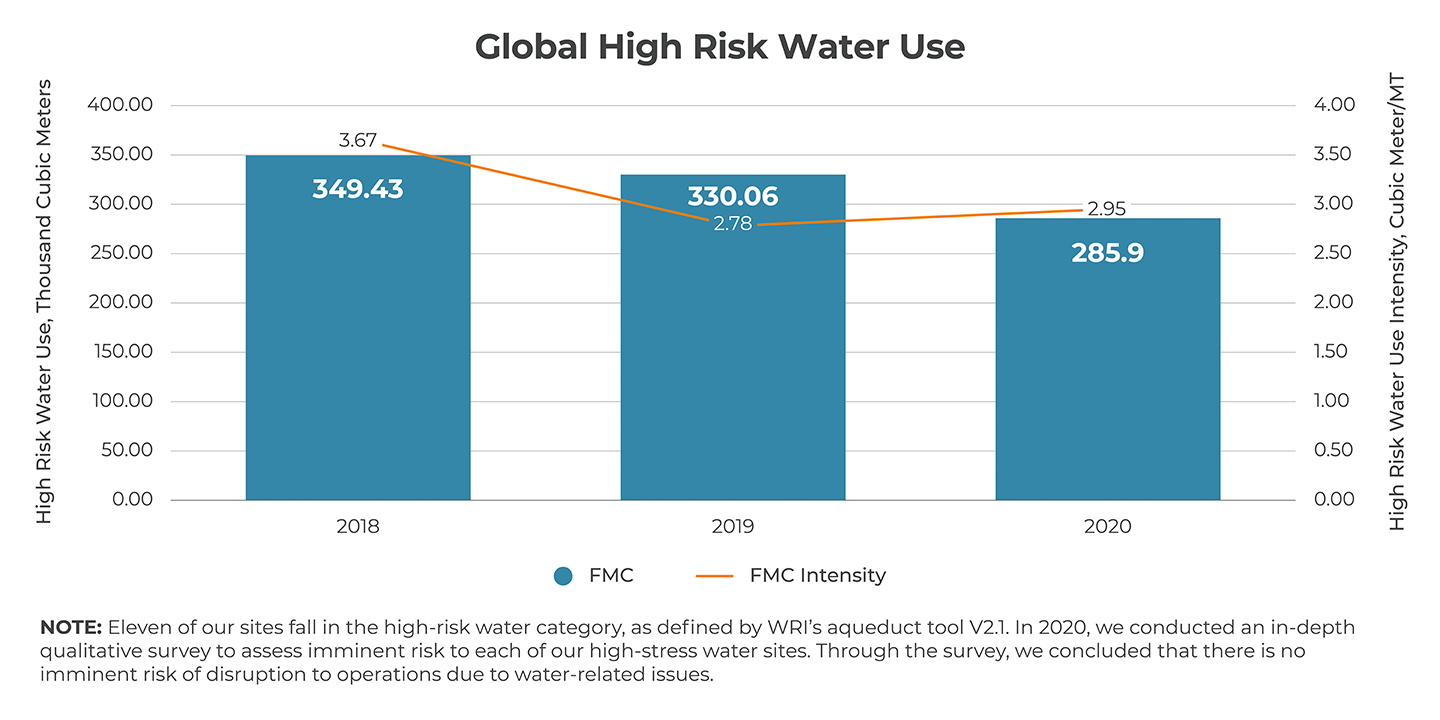
Water-use intensity is calculated as the total amount of water utilized (cubic meter) in high-risk locations per metric tonne of product. This goal is compared to 2018 baseline.
We track water use at all of our material sites. Eleven of our sites fall in the high-risk water category, as defined by WRI’s aqueduct tool V2.1. In 2020, we conducted an in-depth qualitative survey to assess imminent risk to each of our high-stress water sites. Through the survey, we concluded that there is no imminent risk of disruption to operations due to water-related issues.
Waste Goal
Waste disposed intensity is calculated as the total amount of waste disposed (metric tonne) per metric tonne of product. Due to anticipated shifts in FMC’s product mix and expected growth through 2030, waste disposed intensity is expected to increase by 55 percent. Therefore, we will need to decrease our waste disposed intensity by 55 percent to maintain the 2018 base year intensity. This goal is compared to 2018 baseline.
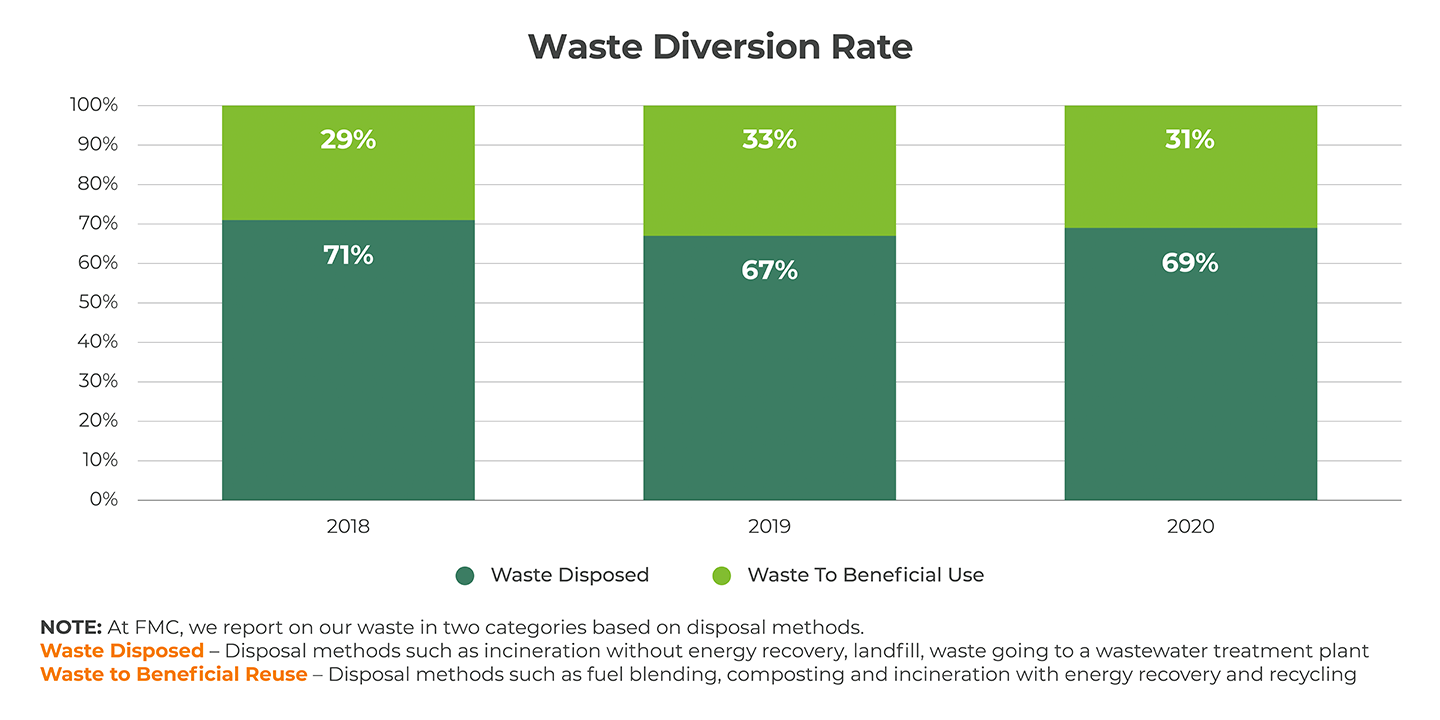
Waste Disposed metrics includes disposal methods such as incineration without energy recovery, landfill, waste going to a wastewater treatment plant. FMC also measures and discloses other waste metrics such as hazardous waste, non-hazardous waste and waste to beneficial reuse (including methods such as fuel blending, composing, incineration with energy recovery and recycling).
Waste Performance
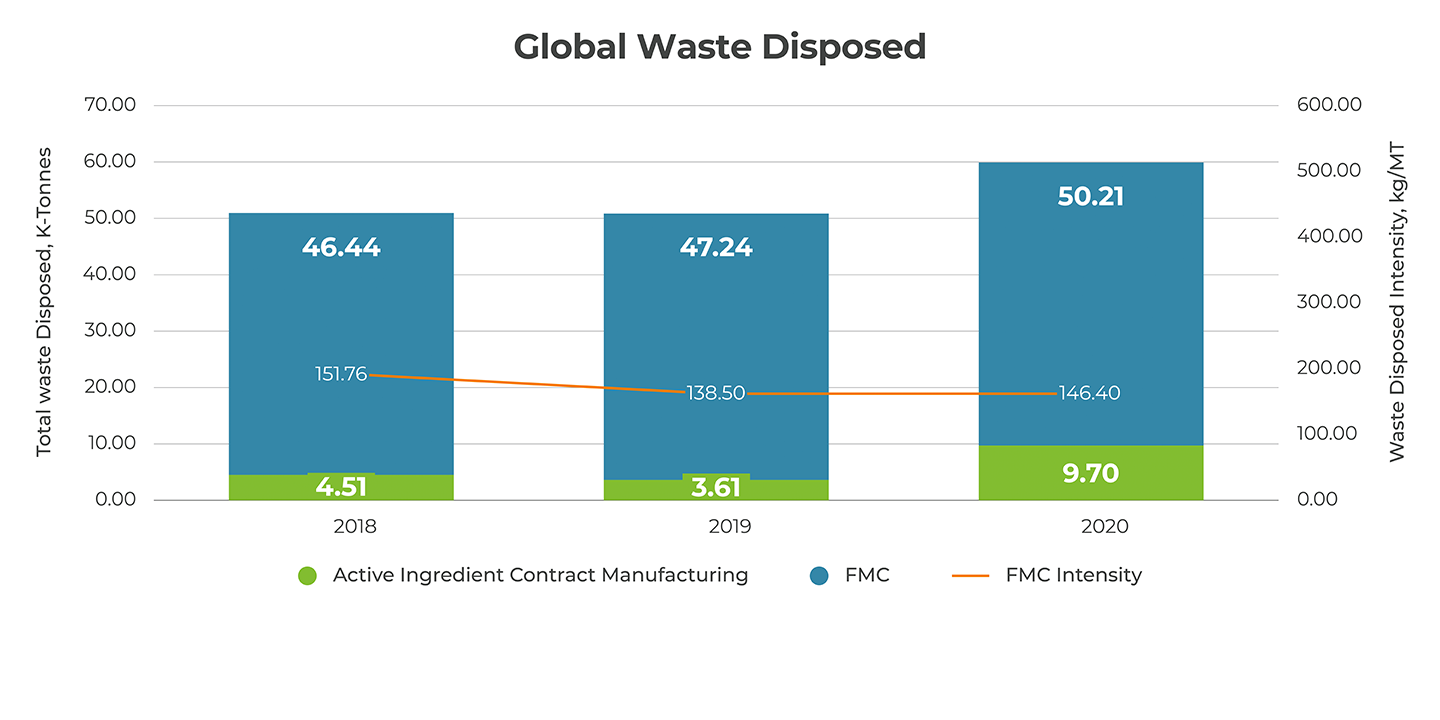
Waste Performance
Environmental Boundary
FMC has a network of manufacturing sites that produce active ingredients (AIs) and perform product formulation, mixing and packaging. We also conduct extensive R&D activities to develop sustainably-advantaged products.
Our environmental goals and metrics pertain to our most material sites, in terms of environmental footprint unless otherwise stated. These material sites include 25 global manufacturing sites and our largest R&D facility in Newark, Delaware. FMC also has a number of smaller R&D facilities, field stations, regional headquarters and country offices. The footprint of these sites is only included in our Scope 1, 2 and 3 emissions reporting to satisfy the GHG Protocol’s completeness principle.
Additionally, some independent companies not under FMC’s operational control reside and operate from within FMC’s sites. Their consumption of energy, water and waste are reported separately and are not included in FMC’s sustainability goals or our GHG emissions reporting at this time.
FMC works with several third-party contract manufacturing sites to produce select AIs and intermediate products. These sites are not under FMC’s operational control and thus excluded from our 2030 environmental goals. We track and report their energy consumption and waste generation amounts separately (more information on these sites listed on page 36).
External Assurance
In 2020, we engaged ERM CVS to perform limited assurance of our select environmental and safety data. The scope of assurance is in line with our environmental boundary and does not include active ingredient contract manufacturers. This partnership with ERM CVS has not only increased transparency in our disclosures, it has also resulted in significant improvement in our data gathering process and accuracy. This year, we have assured an expanded list of metrics that are detailed below. ERM CVS’s assurance letter is located within the annual sustainability report.